Documentation
Introduction
Ths causal mechanisms underlying major psychiatric disorders remain yet to be determined. We hypothesized that the genetic causal variants may be associated with gene expression levels in target tissues as well as neurapthological abnormalities and then the deficits may contribute to the development of major psychiatric disorders. In this perspective, we have analyzed pathology marker experimental results and gene expression levels with corresponding genotypes using data collected from the Stanley Medical Research Institute(SMRI). We have integrated those analysis results with published PGC GWAS results concerning 3 different types of psychiatric disorders in this database. We expect users to find an integrative insight towards etiology of major psychiatric disorders by searching and navigating through this database.
Currently, we have following entities in this database:
- SNPs
- Genes
- Transcripts
- Pathology markers
For detailed statics about this database, please refer to statistics page.
Using database
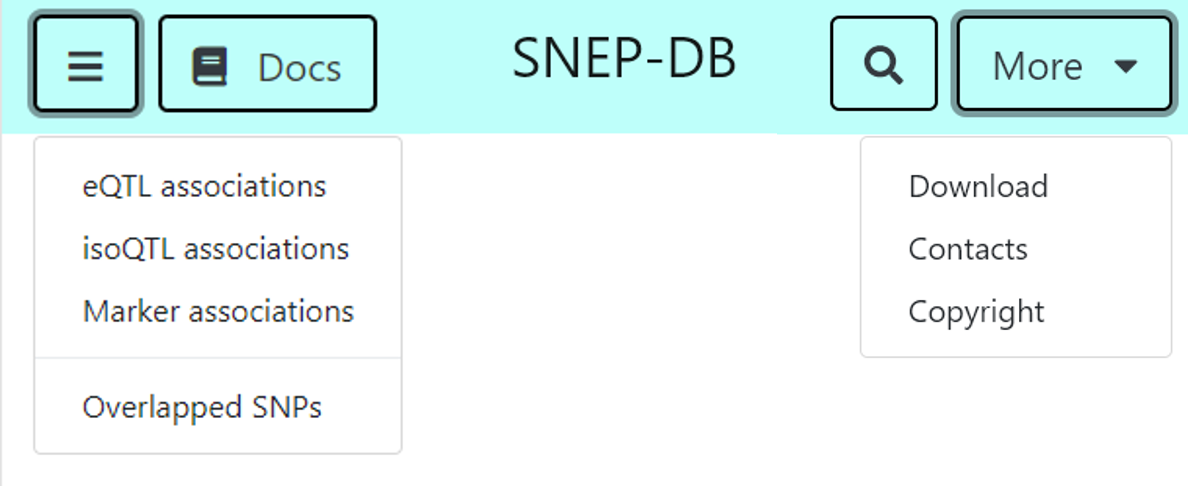
The topbar has two dropdown menus along with link to this page and search page. By clicking the left menu button, you can navigate through various list of associations in ths database. You can search for entities in the search page or mainmenu search form.
Click the floating upper arrow to go to top.
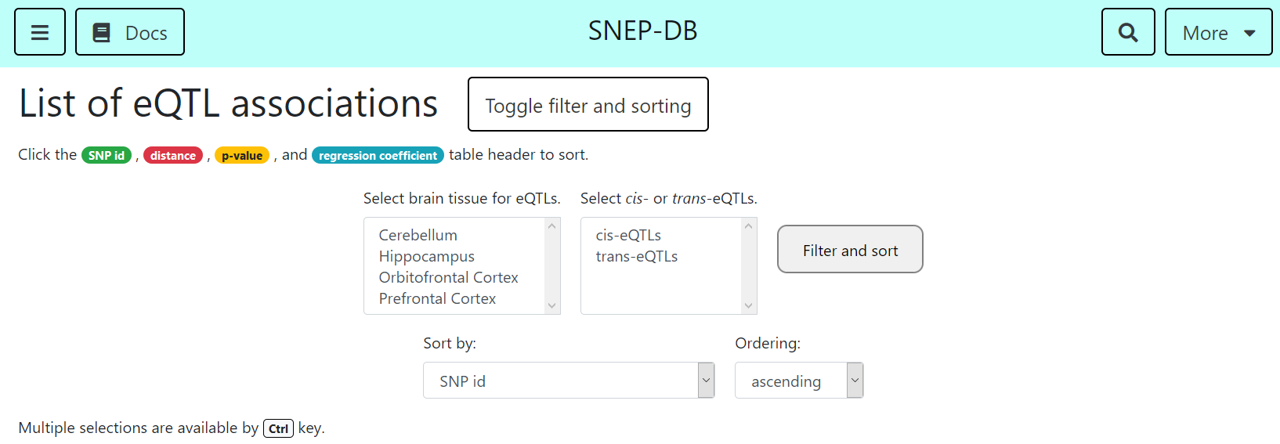
In the 'eQTL associations' and 'isoQTL associations' page, you can navigate through eQTLs and isoQTL associations in their list. Filter for their discovered brain tissues or their association type (cis-eQTLs/isoQTLs or trans-eQTLs/isoQTLs) to narrow down your search interest, with UI on above screenshot. Also, sorting by associated SNP id, gene id(ENSEMBL), association significance and strength is available.
In the 'Marker associations' page, you can navigate through marker associations, and sort them by SNP id or marker id, with similar UI on above screenshot.
In the 'Overlaps' page, you can see the SNPs that has more than 2 associations, which might indicate the key SNP. Also, you can filter and sort the overlapped SNPs, with similar UI on above screenshot.
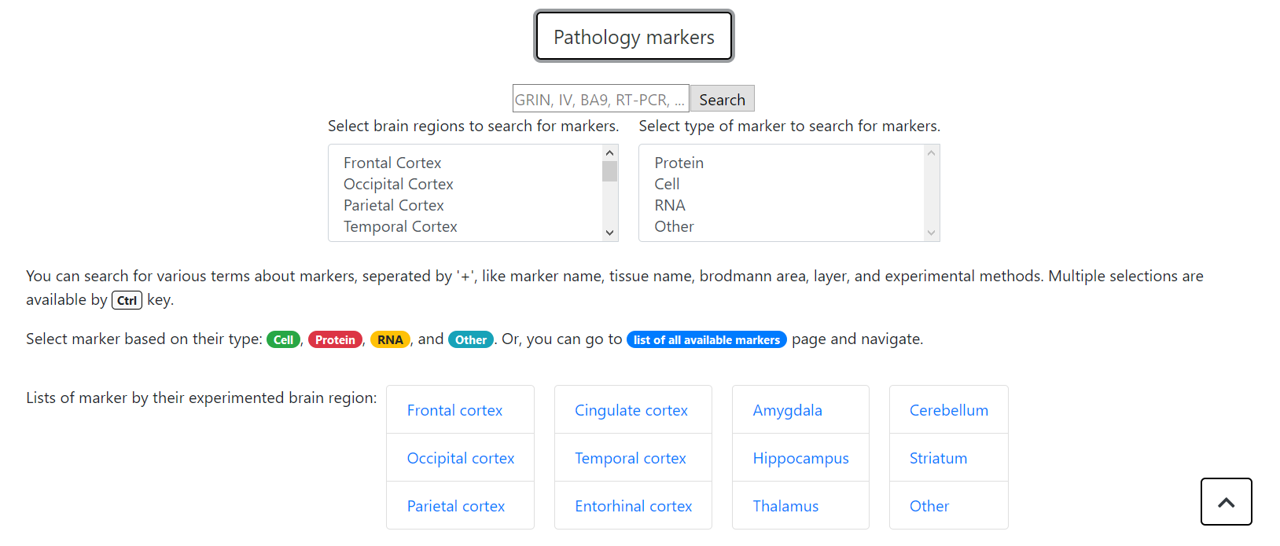
In the 'Search' page you can search for SNPs, genes, transcripts, and markers. For multiple search term, use '+' to merge them. You can search for comples pathology markers using above UI.
Data analyzing, filtering and processing
Data resource
Raw genomics data
We used SMRI's genomics data to process and elucidate meaningful associations between variant and phenotypes. We used whole genome sequencing for genotype data, and RNA-seq data for gene expression levels. Pathology marker data were various experimental results.
For more informations about SMRI genomics data and downloading, please visit here.
Psychiatric disorder GWAS
We used PGC's 3 GWAS on different psychiatric disorders as reference. (schizophrenia, major depression, bipolar disorder) For elucidating proxy SNPs, we used ENSEMBL LD calculator with 500kbp window and LD R2 > 0.8.
Data processing
Preprocessing data
RNA-Seq
We followed GTEx Consortium's genomics data processing pipeline for processing expression levels. As a reference, we used ENSEMBL GRCh38.p12 annotations.
We used RSEM to calculate TPMs per gene/transcript, and normalized using Inverse-Normal Transformation, to get phenotype levels.
Whole genome sequencing
We used samtools to align leads, and bcftools to filter out variants. As a reference, we used ENSEMBL GRCh38.p12 annotations, matching with RNA-Seq preprocessing. Variants which had <0.05 MAF and HWE p-value<1E-8 were excluded. Also, for convenience, we have excluded variants on X and Y chromosome. As a result, about 5M variants survived.
Pathology marker results
No normalization or transformations were applied on marker results, as all the marker experimental results vary in scales and methods. 1 significant outlier(C24) was removed for better analysis.
Calculating associations
Covariates
We included age, sex, psychiatric disorder profile, 15 PEER factors, and top 4 principal components as covariates in caclulating eQTL associations. We used brain pH, psychiatric disorder profile, and top 4 principal components for calculating markerQTL associations. We additionally included sex as covariates for calculating markerQTL associations in cell and other type markers.
eQTL associations
We used QTLtools for calculating eQTL associations. We used 1Mbp window for distinguishing cis and trans eQTL associaitons. The 'conditional' approach mentioned in the original documentation were applied to adjust for multiple comparisons. To briefly summarize the approach, Gene level and transcript(isoform) level were differently calculated.
Marker associations
We used PLINK2 GLM function to calculate associations between variant and pathology marker experimental results. For multiple comparison adjusting, we used hierachical adjustment using bonferroni method and BH FDR adjustment.